By Jeff Clark – the editor of the Delta Report Newsletter
Just about nobody is talking about the rally in bitcoin.
When we looked at the king of the cryptocurrencies last month, we noted the technical pattern of bitcoin looked bullish. The chart was breaking out to the upside of a consolidating triangle pattern. And, we figured bitcoin could be trading back near its December high of about $4,200 within just a few weeks.
Well, here we are, just four weeks later, and bitcoin is trading above $4,000. It’s up 12% over the past month. That’s far better than the 2% gain in the S&P 500 over the same time frame.
But, while everybody is talking about the bullish action in the stock market, the move in bitcoin is being overlooked.
That makes me think there’s a lot more room for bitcoin to rally. And the technical picture backs up that thought.
— RECOMMENDED —
Learn How You Could DOUBLE or TRIPLE Your Account in One Week!
Find Out How With The #1 Selling Trading Guide: Now Yours For FREE!
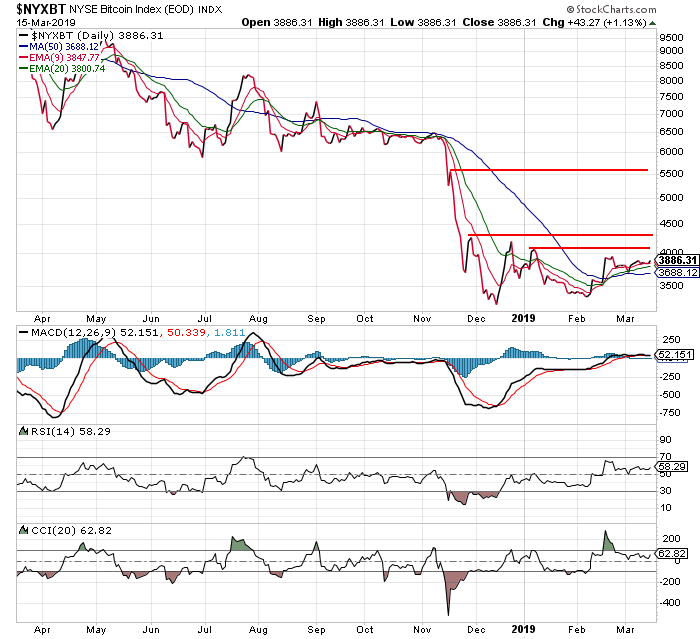
Here’s an updated look at the NYSE Bitcoin Index ($NYXBT) – which tracks the action in the cryptocurrency…

Notice how bitcoin is now trading above all of its various moving averages (the squiggly red, green, and blue lines on the chart). That’s the first sign of bullish price action we’ve seen since last July.
But, unlike last July, when the rally quickly reversed, and bitcoin headed lower, the technical indicators at the bottom of the chart are nowhere near overbought conditions. In fact, they’re all in neutral territory. This tells us there’s still plenty of energy available to fuel higher prices.
Given this setup, bitcoin shouldn’t have any trouble rallying above the first red resistance line at about $4,200. The November high of $4,400 is the next logical resistance level.
But, if bitcoin can get above $4,400, then there’s not any resistance until way up near $5,500.
That’s the sort of move that will get folks talking about bitcoin again.
